
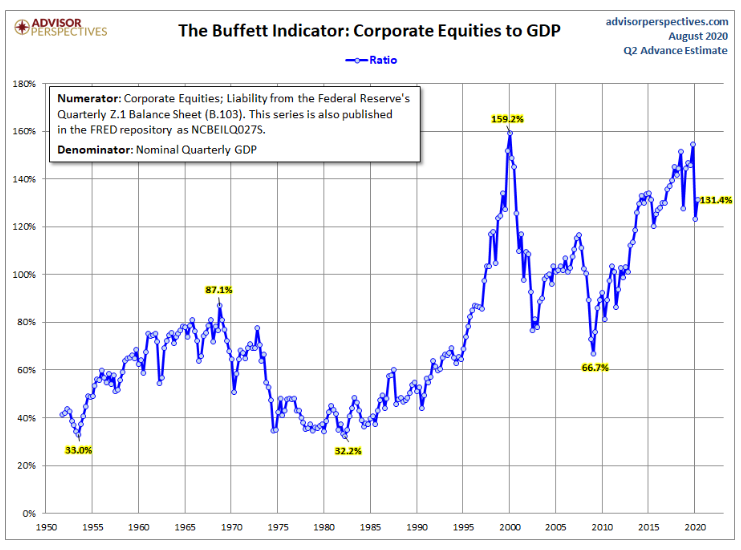
In the aftermath of the dot-com bubble, Warren Buffett made the case that based on the chart below, we all should have seen the crash coming.
In an article published in Fortune Magazine in December 2001, Buffett described his favorite indicator of whether or not the stock market is currently over or under valued as “the market value of all publicly traded securities as a percentage of the country’s business–that is, as a percentage of GNP (Gross National Product).” In other words, the ratio of the total stock market value to the size of the economy itself.
While admitting its simplicity, Buffett called it, “The best single measure of where valuations stand at any given moment.”
In the dot-com bubble, the U.S. stock market’s value relative to the size of the U.S. economy (shown on the chart below as GDP or Gross Domestic Product) reached all-time highs near 160%. To Buffett, that spelled obvious trouble. “For me, the message of that chart is this: If the percentage relationship falls to the 70% or 80% area, buying stocks is likely to work very well for you. If the ratio approaches 200%–as it did in 1999 and a part of 2000–you are playing with fire.”
Do Buffett’s words from 20 years ago still ring true today? We think they do, as stock market valuations are once again climbing to stratospheric levels–around 130% of GDP. What’s particularly concerning today is that GDP is very much in flux as the economy is being massively supported by the Fed and Congressional stimulus programs amidst the pandemic. While the measure is simple in its approach, sometimes the simple answer is best. The stock market is likely getting ahead of itself.
Today, Buffett appears to be following his old advice:
- Berkshire Hathaway continues to hold a record amount of cash on its books ($142B), suggesting he does not see many bargains available.
- The stocks Buffett is buying suggest he is expecting a prolonged downturn due to the pandemic. Recent purchases include Kroger (grocery stores) and Barrick Gold (one of the largest gold producers in the world), both likely to fare relatively well in a downturn.
- Buffett is selling stocks more sensitive to economic conditions (he recently sold his entire stake in airlines and trimmed his holdings in JPMorgan).
While many are now saying Buffett has lost a step as he approaches his 90th birthday this month (as the market has rebounded sharply while he mostly stayed on the sidelines), he may prove to be a step ahead of us this whole time.
PLEASE SEE IMPORTANT DISCLOSURE INFORMATION HERE.